Pothole
hotspots in the UK
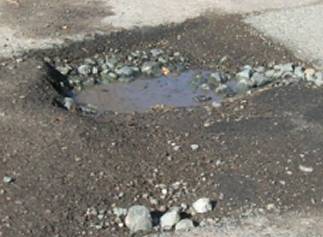
Pothole information
Response from Highways England to a Freedon of Information request
for information regarding pothole information. GOV.UK
website
Just how bad is the pothole crisis in England? A driving school
found out!
Bill Plant, a driving school, say they regularly look into trends
and data surrounding learning to drive and driving conditions in
the UK. Curious to know more they sent a Freedom of Information request
to England’s councils to find out just how bad England’s
pothole crisis is and, specifically, where in the UK suffers from
them the most. See
their blog
Posted: 211104 |
 |
Pothole
hotspots revealed
Research has revealed the areas with the highest and lowest
numbers of potholes in the UK. The data from a Freedom of Information
Request revealed that Cornwall had the highest number of potholes
in the UK, with over 210,000 reported since January 2017. In
terms of cost, Wiltshire has been named as the area which has
spent the most amount of money repairing potholes – an
eye-catching £69m.
Potholes can also cause damage to your car - burst tyres, problems
with suspension and even damage to your vehicle’s bodywork. |
Which
areas reported the most potholes?
| 1.
Cornwall Council |
210,331
|
| 2.
Cambridgeshire County Council |
184,402
|
| 3.
Derbyshire County Council |
172,297
|
| 4.
Devon County Council |
147,779
|
| 5.
Oxfordshire County Council |
110,106
|
| 6.
East Riding of Yorkshire Council |
106,144
|
| 7.
Durham County Council |
99630
|
| 8.
Rotherham Metro Borough Council |
83964
|
| 9.
Hertfordshire County Council |
72,230
|
| 10.
Fife Council |
70254
|
| 11.
Kirklees Metro Borough Council |
67811
|
| 12.
Dumfries and Galloway Council |
65473
|
| 13.
Kent County Council |
64169
|
| 14.
Hampshire County Council |
54958
|
| 15.
Newcastle upon Tyne City Council |
54,641
|
| 16.
East Renfrewshire Council |
51633
|
| 17.
Essex County Council |
48723
|
| 18.
City of Glasgow |
47145
|
| 19.
Wiltshire Council |
43280
|
| 20.
Doncaster Metro Borough Council |
43,118
|
At the other end of
the findings, Kensington and Chelsea recorded the fewest potholes
(141) followed by the Isle of Anglesea (290) and Sunderland
City Council (320). |
Highest
pothole spend by local authority
| 1.
Wiltshire Council |
£68,636,826 |
| 2.
Warwickshire County Council |
£51,234,011 |
| 3.
Cheshire West and Chester |
£38,645,000 |
| 4.
Kent County Council |
£33,400,000 |
| 5.
Cheshire East |
£23,871,807 |
| 6.
Hertfordshire County Council |
£21,749,578 |
| 7.
Essex County Council |
£21,000,000 |
| 8.
Cumbria County Council |
£11,713,000 |
| 9.
Hampshire County Council |
£11,004,031 |
| 10.
Cornwall Council |
£10,528,114 |
Lowest pothole
spend by local authority
| 1.
Stockport Metro Borough Council |
£24,323
|
| 2.
Royal Boro of Kensington & Chelsea |
£33,720
|
| 3.
Rutland County Council |
£44,200
|
| 4.
London Borough of Lambeth |
£123,468
|
| 5.
Gloucestershire County Council |
£134,869
|
| 6.
London Borough of Southwark |
£139,232
|
| 7.
London Borough of Haringey |
£142,793
|
| 8.
Cardiff Council |
£228,733
|
| 9.
Midlothian Council |
£256,670
|
| 10.
London Borough of Bexley |
£284,424
|
|
|

